


Transcriptome-based identification of candidate membrane proteins
Evans EJ, Hene L, Vuong M, Abidi HS, Davis SJ. (2009), Methods Mol Biol. 528, 37-56
DetailsAt around about the year 2000, with the advent of the Human Genome, it seemed to us to be important to determine whether, in the case of the T cell surface, the protein discovery process had been completed. This was of special interest to SJD, as knowing the absolute composition of the T-cell surface had for a long time seemed like a worthwhile but difficult goal. It had been something that had piqued his interest when he arrived in Oxford to start working with Alan Williams, who pioneered the method of identifying leukocyte antigens using monoclonal antibodies. (In fact, on this first day in 1987, SJD asked Alan how far did he think he’d gotten identifying all the surface molecules, whereupon Alan said “About half way”. SJD was just pleased to come up with such a good question on his first day.)
We used SAGE, a relatively deep transcriptome tagging and mining method, to characterize the expression of transcripts encoding known cell surface molecules by a human CD8+ cytotoxic T cell clone, and showed that 111 of these genes are expressed (1) (Fig. 1). We also showed that, although ~45% of the moderately- to highly-abundant, stringently-defined, CD8+ T cell-specific transcripts have no known function, very few of these encode proteins with transmembrane domains, and that none of these proteins have the modular architecture characteristic of leukocyte surface antigens. Although we were initially disheartened that there wasn’t a nice large set of novel genes to study, we eventually realized that it was an important staging-point in the analysis of the immune system as it provided the first insight into the overall complexity of the T- (indeed any) cell surface and indicated that the real task was to understand how the known proteins worked. Since all the key cell surface molecules constituting the basic triggering apparatus of this cell therefore appeared to have been identified, we suggested that existing triggering models, e.g. the KS model, could not be wrong because key elements are missing. They could only be wrong for other reasons. We also showed that tissue-specific gene expression stratifies with protein functional-class, that tissue-level regulatory changes accompany the activation and/or lineage commitment of CD8+ and CD4+ T cells, and that the least well-characterized compartment of the T cell-specific transcriptome encoded signalling molecules.
Although this quickly became one of our least-cited studies, it nevertheless had some impact at the time it was published. We felt that the study signalled the “end of the beginning” of the analysis of the T-cell surface, which started with the generation of the first anti-T cell monoclonal antibodies by Alan Williams and Cesar Milstein in 1977. Following completion of the survey in November 2002, no new resting T cell surface proteins were discovered. We subsequently extended the analysis to NK cells and to transcripts encoding “house-keeping” surface proteins, of which there are 280. We are presently combining this data with a proteomic analysis of Jurkat T-cells in order to try to produce an actual physical map of the T-cell surface.
Schematic representations of the defined and proposed CD antigens and TCR components whose expression in clone 32 was detected by SAGE are shown. The two new seven TM proteins identified are also included (italics). The architecture of these proteins is drawn approximately to scale according to the conventions of (2). Unconventional domains or those for which there are no structures are labeled “?”. The molecules are colored according to transcript abundance per 100,000: purple, ≤3; blue, 4–9; green, 10–27; orange, 28–81; red, >81. Complexes are represented at the level of the most abundant subunit-encoding transcript.
*Stringently defined, CTL-specific molecules.
‡Five integrin α domains were detected in clone 32 by our analysis: CD11a, CD49a, CD49c, CD51, and CD103, which associate with the integrin β chains CD18, CD29, CD61, and β7. Tags derived from CD18 and CD61 were found at high levels in the library but matched several other genes, preventing abundance determination. Integrin β7 tags were also present, but this protein has not been considered for a CD designation. No tags derived from CD29 were observed, presumably due to sampling effects.

Evans EJ, Hene L, Vuong M, Abidi HS, Davis SJ. (2009), Methods Mol Biol. 528, 37-56
Details
Abidi SH, Dong T, Vuong MT, Sreenu VB, Rowland-Jones SL, Evans EJ, Davis SJ. (2008), Cell Res. 18, 641-8
Details
Hene L, Sreenu VB, Vuong MT, Abidi SH, Sutton JK, Rowland-Jones SL, Davis SJ, Evans EJ. (2007), BMC Genomics. 8, 333
Details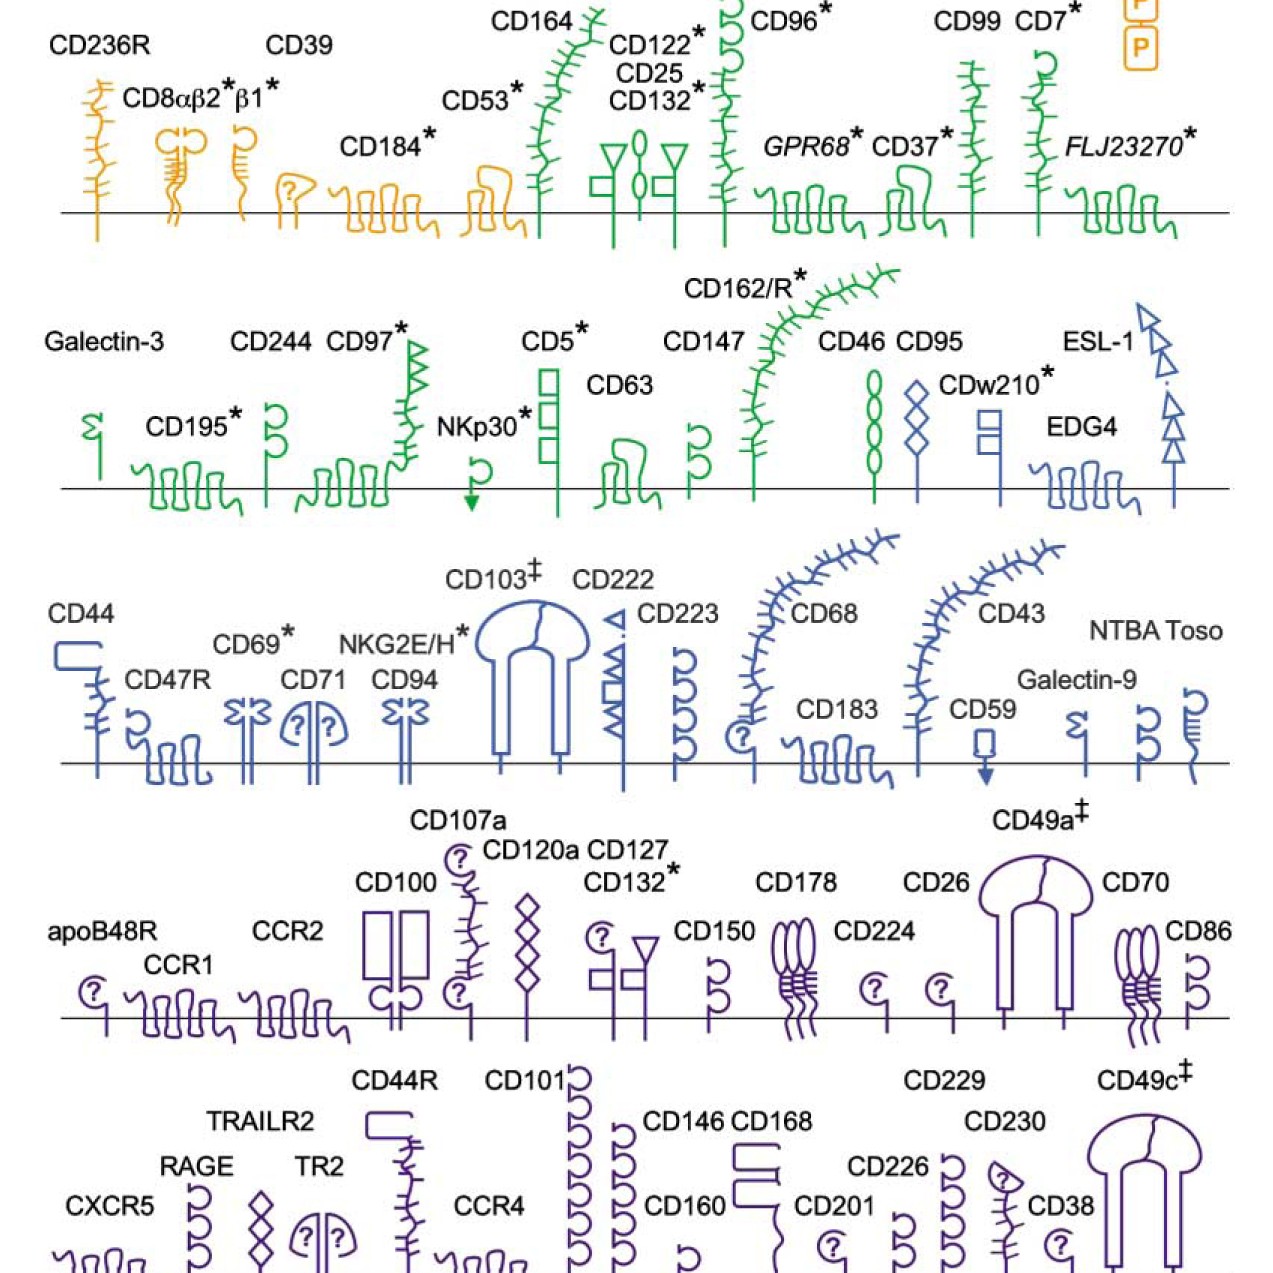
Evans EJ, Hene L, Sparks LM, Dong T, Retiere C, Fennelly JA, Manso-Sancho R, Powell J, Braud VM, Rowland-Jones SL, McMichael AJ, Davis SJ. (2003), Immunity. 19, 213-23
Details
Davis SJ, Davies EA, Tucknott MG, Jones EY, van der Merwe PA. (1998), Proc Natl Acad Sci U S A. 95, 5490-4
Details
Davis SJ, Puklavec MJ, Ashford DA, Harlos K, Jones EY, Stuart DI, Williams AF. (1993), Protein Eng. 6, 229-32
Details